I asked Agnes, our resident actuarial genius to run some more numbers on the crude oil and commodities correlation series that we had been playing with. Here is what she turned in today before heading home. If you have just arrived, the concept is simple. In times of stress correlations break down. Sometime they return closer to the levels seen when markets were not stressed. If you were to assume that correlations would head back to normal at some point in time, what type of prices are you likely to see. If you extend this analysis you are basically saying that for the following list of commodities, if true correlations (such a thing existed) were to come back to the market you are likely to see
- Gold at sub US$1,000
- Silver at some level below US$ 14
- Platinum at US$ 1,540
- Steel at US$ 1,750
- Copper and Aluminum fairly priced
Don’t kill the messenger; I am just a quant with a model. If you want to prove me wrong, go put some capital at risk. Details follow:
[ad#Grey back med rectangle]
Part 2: Precious and Other Metals
Gold
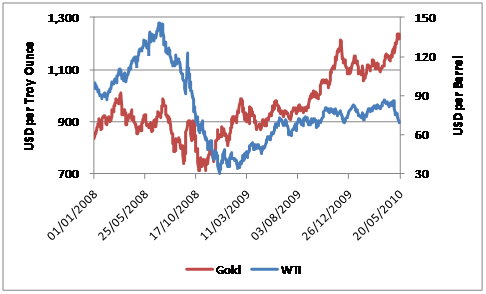
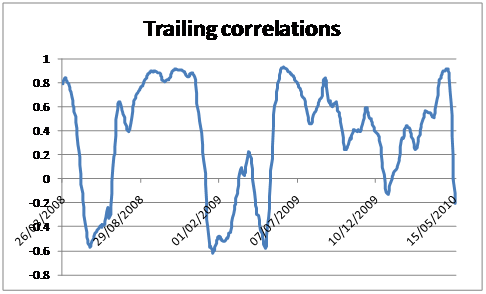
Historically the prices of WTI and Gold reveal that they don’t necessarily move in tandem. This is also seen in the trailing correlations graph below where the correlation over the period has been fairly unstable. From the price data above we see increasing correlation between gold and crude oil in the second half of 2009 but since February 2010 we see that whereas gold price continued to increase at an increasing rate, crude oil growth has been relatively flat finally experiencing a downturn in May 2010. This has resulted in an increasingly negative correlation in May 2010.
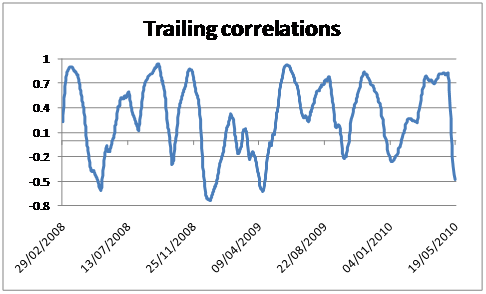
Assuming that correlations seen in mid-March and April 2010 were to persist at around 0.80 and assuming that it is gold price that is currently mispriced, gold prices should currently be at the USD 900 level i.e. USD 300 lower that where it currently stands in order to maintain the relationship between crude oil and gold.
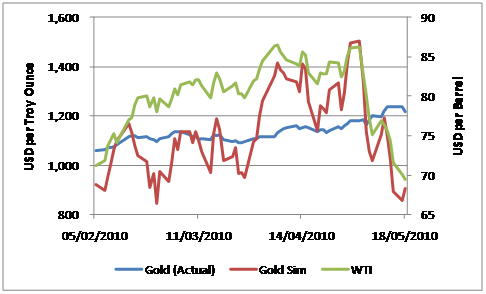
Alternatively assuming that WTI and not gold is mispriced, crude oil prices should have increased to USD 102.
Using simulated gold prices and actual WTI prices, the quantity of gold that can be exchanged for the value of 1 barrel of crude oil is given below:
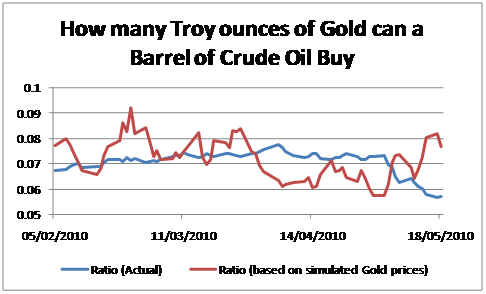
The actual ratio depicts that gold has become more expensive in relation to crude oil, where fewer troy ounces of gold could now be purchased for the price of 1 barrel of WTI as compared to the past. Using simulated prices which assume the correlation between WTI and Gold prices persists at 0.8, gold is much cheaper with 0.077 troy ounces being able to be purchased instead of the current quantity of 0.057 troy ounces.
Silver
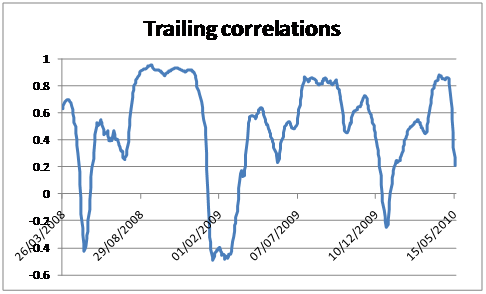
Silver prices show a similar trend in correlation with WTI prices as compared to gold.
Assuming that during May 2010 the trailing correlation was to remain at 0.75 which was the average experienced in April 2010 instead of sharply declining and becoming negative, the price trend for silver would have been as follows:
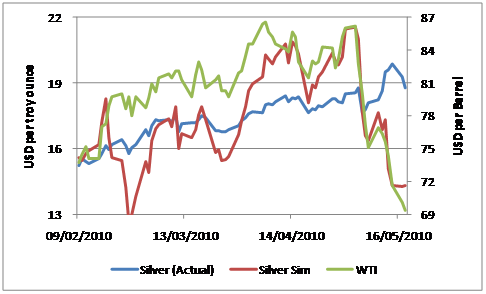
The simulated price is in the region of USD 14 per troy ounces whereas the actual price was around USD 19. Alternatively if WTI was mispriced relative to Silver, crude oil would have to be priced at over USD 81 per barrel for the assumed correlation to hold instead of the actual price of USD 69 per barrel.
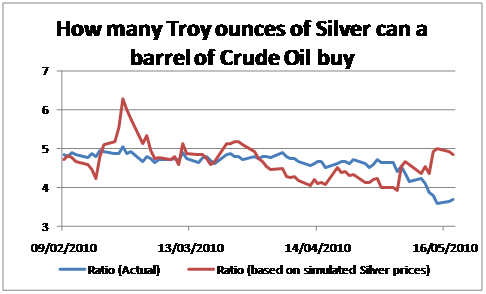
Using the simulated prices of Silver and the actual prices for WTI, silver would be cheaper at 4.84 troy ounces compared to the actual position of 3.69 troy ounces.
Platinum
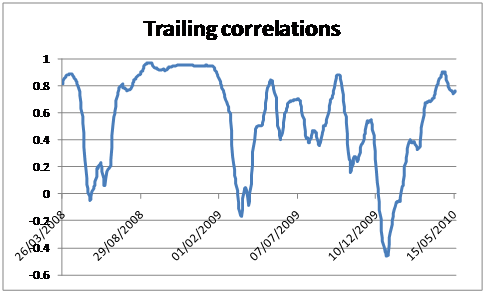
Trailing correlations in April 2010 averaged around 0.84. In May 2010 the correlations fell approaching 0.2 by 18 May 2010. This is not unusual considering the trend in the graph above where the correlation has been relatively unstable over the duration of the study. However if the correlation had remained at April 2010 averages, the progression of Platinum prices would have been as follows:
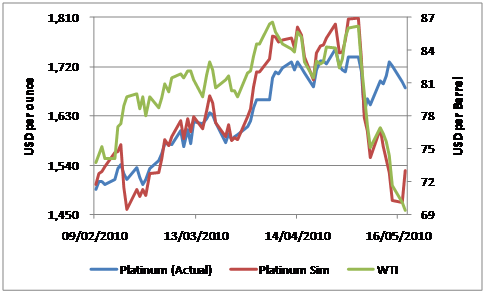
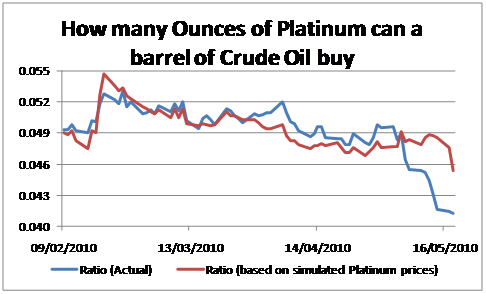
If the correlation had been maintained then the price of platinum would be USD 1,530 per ounce instead of USD 1,681 per ounce. Alternatively if WTI prices were adjusted to account for the assumed correlation they would stand at USD 75 per barrel instead of USD 69 per barrel. In addition in relation to crude oil platinum would also be cheaper exchanging at 0.045 ounces of platinum instead of the actual position of 0.041 ounces for 1 barrel of WTI.
Aluminium
Even though the correlation trend has been quite erratic what we do see it that it has on the most part remained positive. For a considerable period of time during the entire duration correlations have exceeded 0.8. Assuming that correlations had remained at April 2010’s average of 0.82 in May 2010 the price trend would have been as follows:
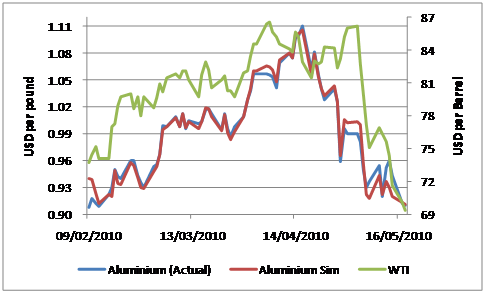
The simulated prices are very close to the actual prices. Simulating WTI prices instead of Aluminium prices the cost of a barrel of crude oil would have been USD 68.71 instead of 69.38.
Relative to crude oil aluminium costs nearly the same regardless of whether the simulated or actual position is considered.
Steel
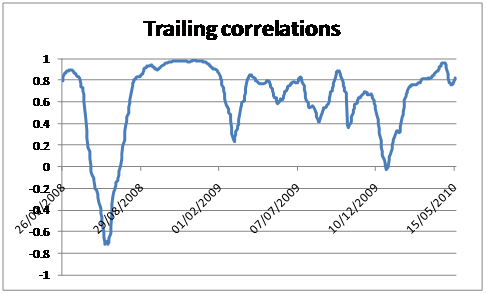
Correlation between WTI and Stainless steel scrap (Steel) prices do not show a stable trend as can be seen above. However using the average for the month of April 2010 of 0.69 and assuming that this correlation had held in May 2010 the trend in prices would have been as follows:
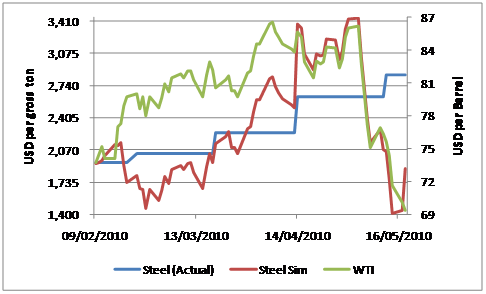
Simulated steel prices are considerably less than the actual prices at USD 1,881 per gross ton as compared to USD 2,850 per gross ton. If steel prices are assumed to be at the correct level given the assumed correlation WTI prices should be at USD 85 per barrel and not USD 69 per barrel.
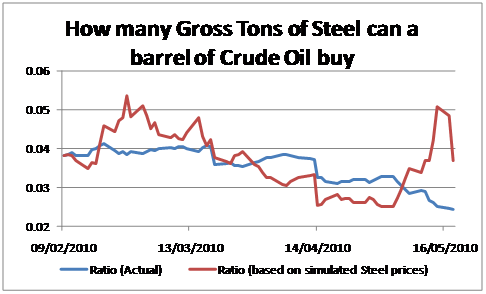
Based on the simulated steel prices and actual WTI prices, a greater quantity of steel can be exchanged for 1 barrel of crude oil as compared to the actual current position.
Copper
Correlation between copper and crude oil has generally remained positive but the magnitude or strength of that relationship has varied considerably over time. For a significant part of the duration the correlation has exceeded 0.8. For the month of April 2010 the average trailing correlation was 0.9. Assuming that this correlation had continued into May 2010, the trend in copper prices would have been as follows:
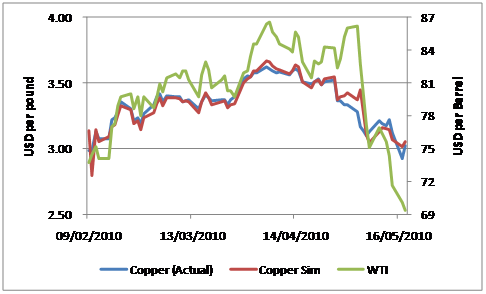
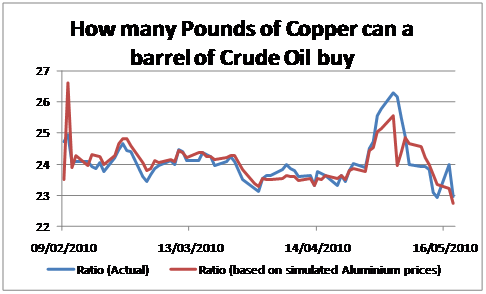
We can see that the simulated and actual prices are very close. The same is true if WTI instead of copper prices had been simulated. This is also illustrated in terms of the quantity of copper which can be purchased from the value of one barrel of WTI as seen below.
[ad#Grey back med rectangle]