My first introduction to crude oil volatility happened at a client site. I was asked to suggest a hedging strategy for minimizing their exposure to crude oil volatility. I always thought that the different blends tend to move together and that a simple future or option contract on WTI (West Texas Intermediate) would solve the problem for everyone. But I was mistaken.
On this side of the planet, the most relevant blend is a Middle Eastern blend, traded under the generic name of Arab Light. With the blend there are specific flavors and benchmark. From shipping and logistics point of view we searched for the Dubai and Oman benchmark. From a flavor point of view we looked at Upper Zukam, Murban, Iran Light and Iran Heavy in addition to ARAMCO, the largest reference point and benchmark for Middle Eastern blends.
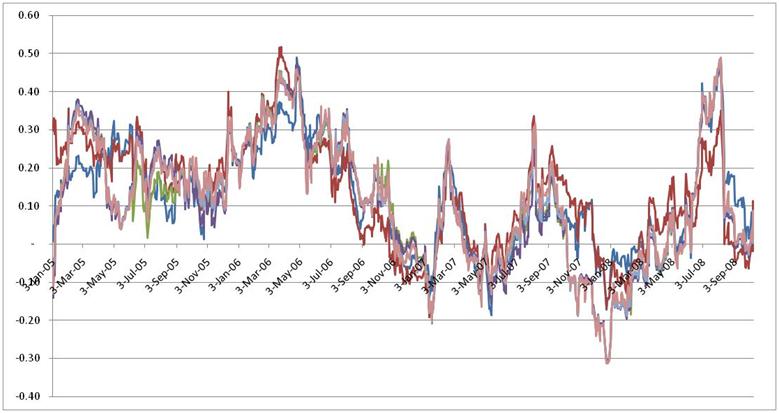
For the hedging exercise we picked Murban (since the client bought it directly from ADNOC) and used it as the primary hedging benchmark against daily prices changes starting from 1995 to 2010. To test for hedge effectiveness we tracked 60 day trailing correlations across the blends. The resulting picture, to put it mildly, was anything but pretty. From a hedge consultant point of view it was a nightmare on Wall Street. And like a nightmare, it needs to be told in multiple episodes.
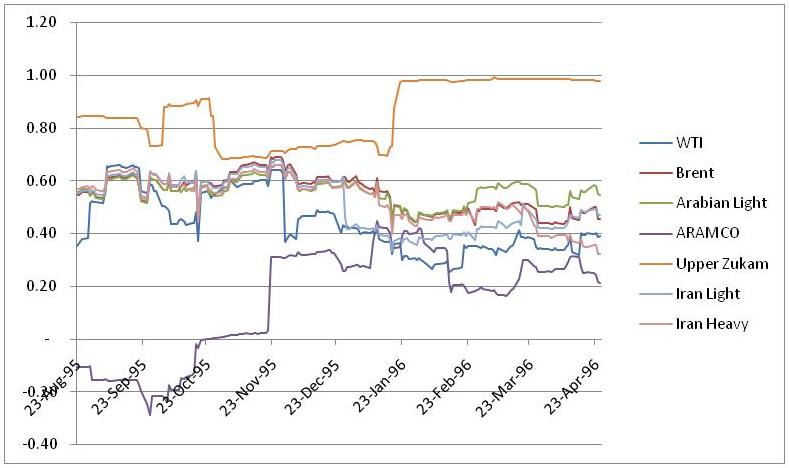
Episode I starts in 1995 and runs till 96. It is an interesting period because Zukam and Murban, both blends produced and priced by ADNOC for the last part of 1995 were not perfectly correlated. The dark horse though was ARAMCO, a middle eastern blend that sort of ran its own ship throughout this period while the rest of the world atleast from a price correlation point of view walked the middle road with Murban.
Episode II ran from 1996-1999 where except for a few dips and swings the oil producer of the world acted in fairly uniform consensus. Price correlations started in the mid 40% and ran for all of 98 and 99 in the 60% – 80% range. A hedger and consultants dream.
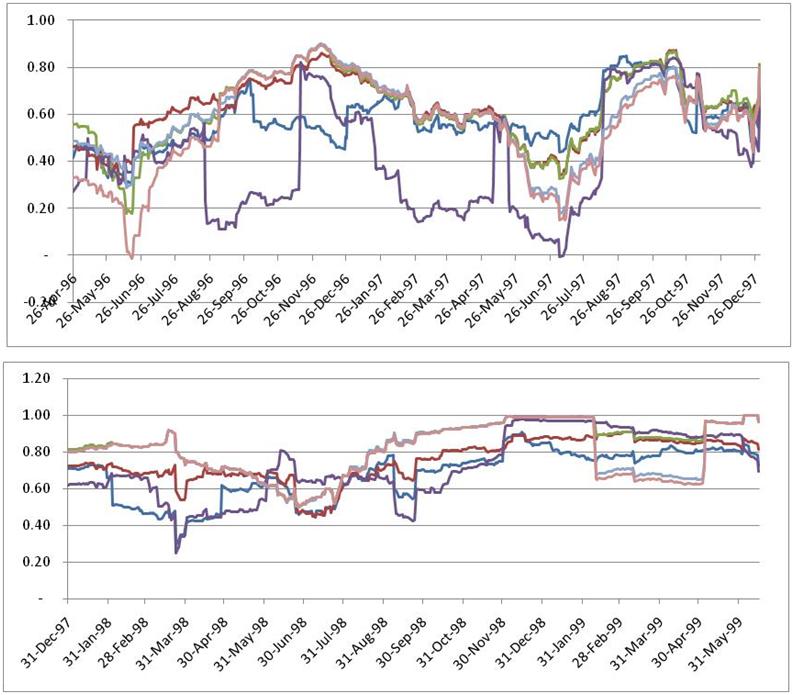
1999-2002 became Episode three, more dips and hills and yet averaged out higher correlations.
Till we came to Episode IV and April 2003 when the world was clearly split in two distinct camps, WTI and Brent on one side and the rest of the world in the other.
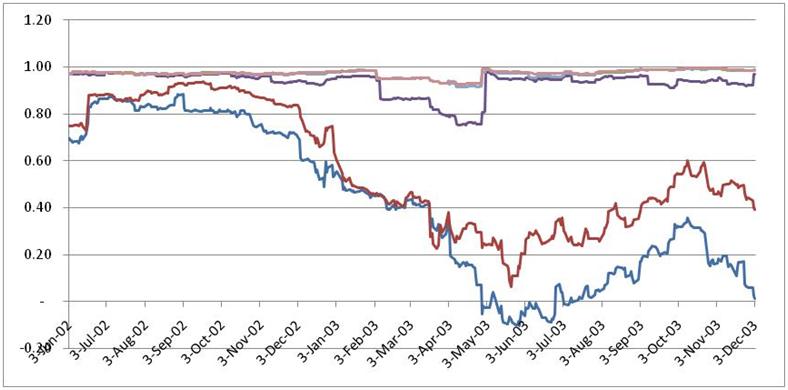
It took just a few months for the two camps to merge together and we not just saw lower correlations with the Murban blend (the focus of our study) but even periods of reasonably high negative correlation.
[ad#Grey back med rectangle]
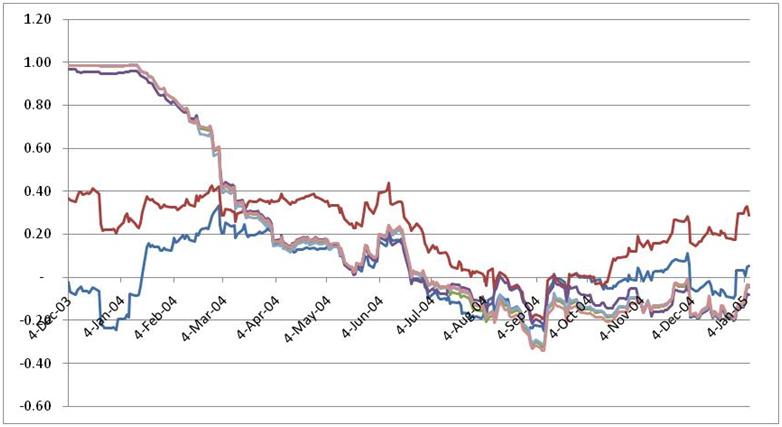
And then in the next three years it was the canvas of a mad artist.
And it remained that way to this day.
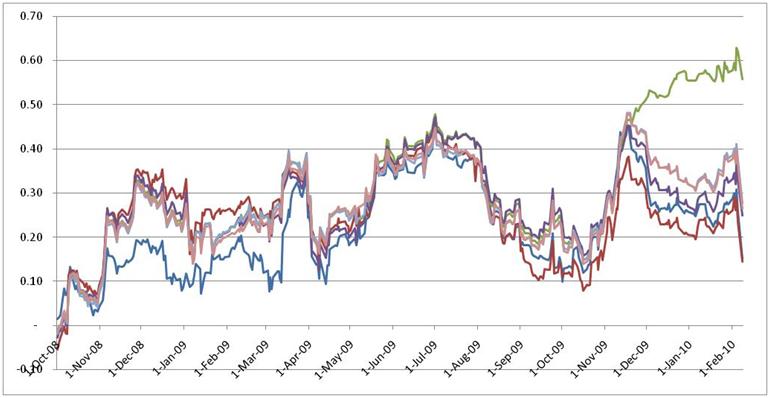
So the challenge now for a risk, crude oil and fuel hedger is that even if you found a hedge that made sense at the time of your recommendation, most hedge effectiveness tests required under the accounting standards would fail with this level of volatility across crude oil blends. And since liquidity and volume when it comes to derivative contract, still remains in WTI and Brent, for the rest of the world that lives off the Middle Eastern flavors, the right hedge will remain the elusive mystical prize at the end of the quest from Arabian nights.
[ad#Grey back med rectangle]