I am not into fancy arguments. I just need one graph and a handful of facts to make up my mind.
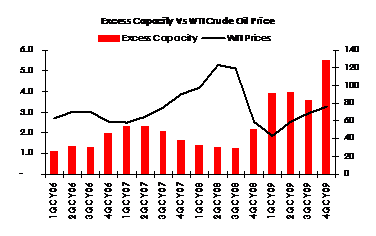
Fact number one – The thick red line suggests that end of Q4 2009, the world excess production capacity stood between 5.5 – 6.0 million barrels of oil per day.
Factor number two – The last time crude oil prices crossed into triple digits, this number stood at under 2 million barrels of oil per day, or about one third of current levels.
Fact number three – Crude Oil OECD demand has been in deep-south mode and is expected to stay there in the near and midterm future. Even if the economy grows for generation of power, electricity, air-conditioning and heating we have a much more affordable substitute in North America that goes by the name of Natural Gas.
Factor number four – We talk about demand coming from China, India and APAC but the derivative products markets suggest otherwise. And as in the case of Pakistan and China, removal of fuel subsidies leads to a slackening of demand on the consumption side. The inelasticity turns elastic. The question you need to ask yourself is much did Sinopec sell in 2009? How much will they sell in 2010?
Fact number five – China says they don’t really like Gold that much. Now you can read that statement in as many ways as you want but one translation is linked to Gold’s inflationary hedge status. If China is not seeing inflation, they are possibly not seeing growth, they may even be seeing deflation. And if they are not seeing growth does that explain why what is happening in Ethylene, EDC, VCM and PVC markets is happening.