This is the first post of a two-part series in which we shall be looking into the trailing correlation between world crude oil prices and the two benchmark price indexes, Brent and the WTI.
There are several different types of crude oil which are extracted and refined worldwide. However, two of these standardized types are traded in the futures markets in New York and London, namely the West Texas Intermediate (WTI) extracted from the US, and the Brent Future, extracted from the North Sea in Europe. The prices of other types of oil are determined as either deductions or surcharges on these two main oil markers.
WTI is of very high quality. Its API gravity of 39.6 degrees makes it “light” oil, while its sulfur content of 0.24 percent makes it “sweet”. These characteristics make it an excellent choice for refining.
Brent crude is a combination of oil extracted from 15 oilfields in the Brent and Ninian systems located in the North Sea. Its API gravity of 38.3 percent and sulfur content of 0.37 percent make it less “lighter” and ‘sweeter’ than WTI. However, it is still of an excellent quality to be used in refining.
In general, we see that the prices of crude oil produced in the major oil producing hubs of the Middle East, namely Abu Dhabi, Dubai, Iran and Saudi Arabia seem to be more closely correlated with Brent spot prices rather than with the WTI spot prices. This has been especially evident in the past few months with the development of a much more pronounced spread between WTI and Brent prices, ever since fighting erupted in Libya. We also notice a lag between this region’s prices and those of WTI and Brent, especially with Brent prices. Increases and decreases in Brent price are followed by the consequent increases and decreases in the spot prices of these crude varieties a week or so later.
The following two graphs highlight the changes caused in the spot prices from the major oil producing countries in the Middle East due to changes in the Brent and WTI prices.
Spot Prices
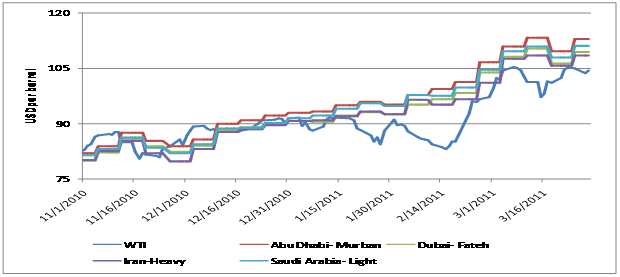 With WTI
With Brent
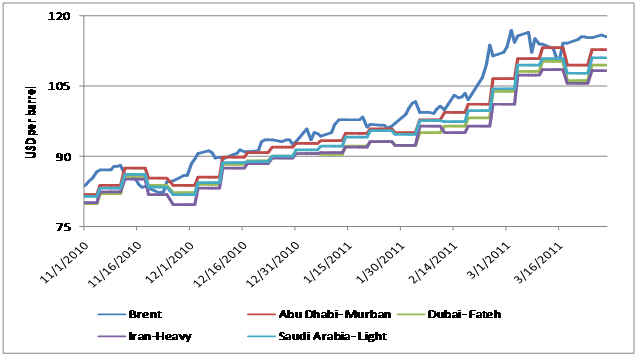
We can infer from the two graphs above that changes in the Brent prices lead to a much more pronounced change in the spot prices from the individual oil producing countries. Also, a time lag can be observed between a change in the Brent price and a consequent change in the spot prices.