In the following series of posts, we shall delve deeper into analyzing crude oil in terms of its relative price in different currencies, the correlations between different currencies and oil prices, and the correlation between crude oil and gold.
Crude Oil Analysis: Correlations of Crude Oil Price with Various Currencies
We shall now be looking into the correlation between WTI crude oil prices and some of the major currencies of the world. We shall be doing this by tracking the WTI spot price of oil and the exchange rate of the major currencies over the period from April 2006 till March 2011, and shall then look into the correlation existing between them.
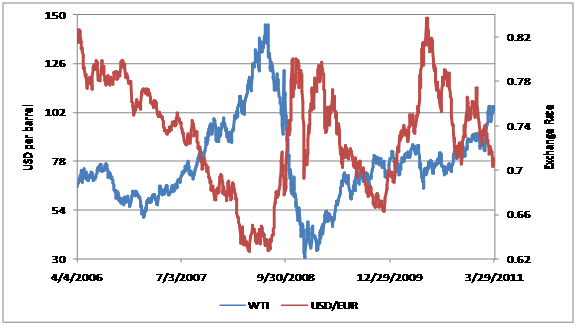
USD-EUR
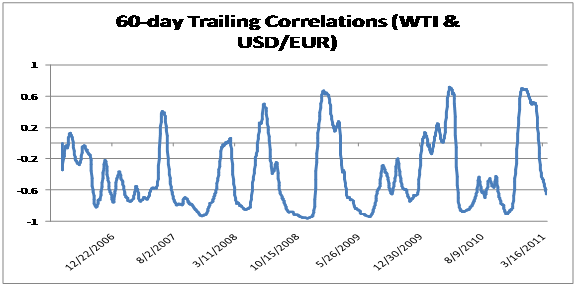
On average the correlation between WTI spot prices and the USD-EUR FX rates over the 5-year period have been markedly negatively correlated, -0.69 to be precise. This is evident from the price/ FX rate graph below as well as from the 60-day trailing correlations graph where the graph predominantly returns below 0, even though there are occasions when the exchange rate has moved in tandem with WTI spot prices, mostly recently in the last quarter of 2010.
Prices
Trailing Correlations
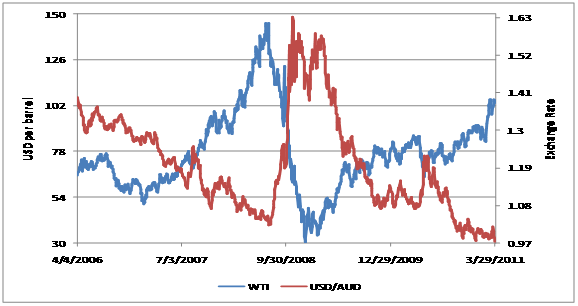
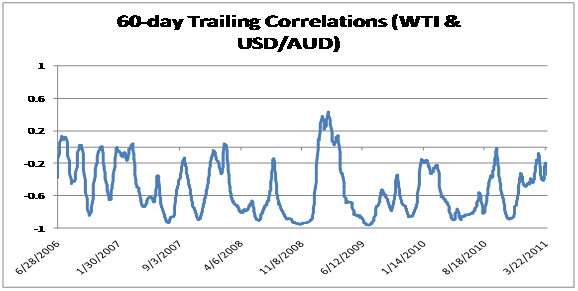
USD-AUD
The USD-AUD exchange rate displays a higher correlation with WTI spot prices as compared to the USD-EUR exchange rate. The 5-year average correlation figure is -0.72. There are also much fewer instances where the correlation coefficient has exceeded 0, i.e. movements in USD-AUD are usually in the opposite direction to movements in WTI prices, even though the strength of the negative correlation has varied over time.
Prices
Trailing Correlations
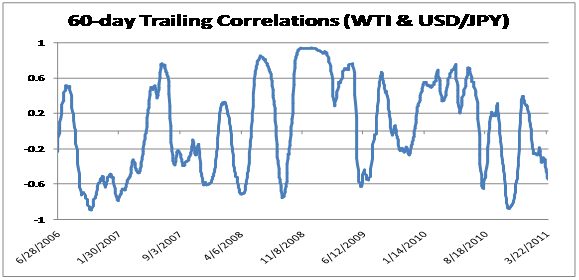
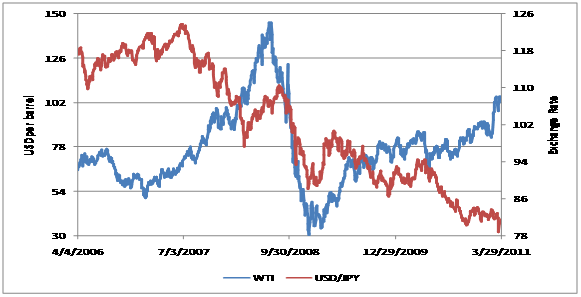
USD-JPY
Over the 5-year analysis period, the correlations between WTI spot prices and the USD-JPY exchange rate have been negligible at -0.05. Trailing correlations also indicate that correlations with WTI overtime mostly remained in the negligible to moderate levels (whether positive or negative). As of 29th March 2011 the 60-day trailing correlation coefficient stood at -0.55. The price/ FX rate graph below show that USD-JPY exchanges have a definitive downward trend over the years which appears to be independent of the changes to WTI spot prices.
Prices
Trailing Correlations