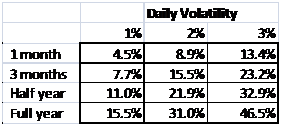
Before we get into actual crude oil volatility figures, here is a quick ready reference that you can use to interpret the graphs and data series below.
A 1% daily volatility number scales into a 15.5% annualized volatility estimate. A 3% daily volatility number scales to 46.5%.
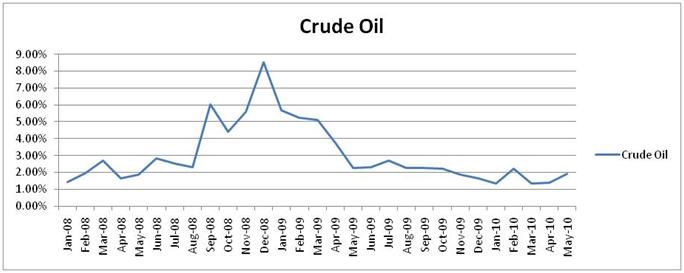
Here is the trailing volatility for crude oil over the last 2.5 years. While the historical annualized volatility in May stood at 31%, the implied volatility being used to trade options right now is around 47%. The market is charging a 50% premium or anticipates that volatility will rise further in the coming months
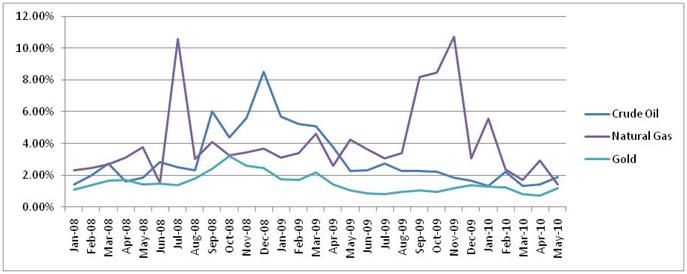
How does that compare with Natural Gas and Gold?
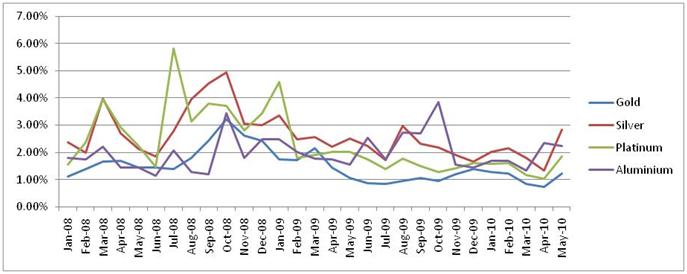
Or other precious metals and Aluminum when compared to oil? Do you see the volatility spike in May in Platinum and Silver?
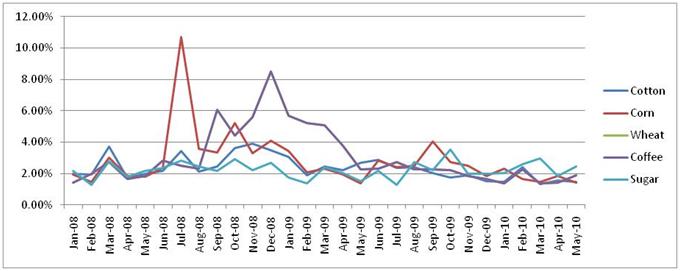
And major crops? Cotton, corn, wheat, coffee and sugar? Crude oil volatility is high, but not as high as silver and sugar or as volatile as Natural Gas.