What can a barrel of crude oil buy and does that tell us anything at all about the direction and relative value of oil prices. Staring Monday morning I will officially go ahead and short oil. For the rationale for this suicidal move, please see the following evidence. Price across the commodity universe are back at the pre-crash 2008 level. One could argue that the world around us is back to normal but every where we see we can identify evidence that suggests that while growth is back, it is a very different world with a very different outlook than June 2008.
The data
We have carried out our analysis over the period for the period 1-January-2008 to mid March 2009. For the analysis all commodity prices have been denominated in USD, i.e. prices for those commodities such as silver and crude palm oil futures which are normally expressed in another currency (Sterling and Malaysian Ringgit respectively) have been converted to the US currency by applying the relevant exchange rate for the given date.
All prices are cash commodity prices obtained from the Wall Street Journal website expect for Crude Palm Oil prices which are settlement prices of spot month futures contracts available from the Bursa Malaysia website and WTI Crude Oil prices which are spot prices obtain from the Energy Information Administration website.
A given point on the trend line in the graphs below represent the ratio of the per barrel WTI spot price to the per unit price of the respective commodity being analyzed over time. The resulting number quantifies the equivalent units of a given commodity to that of a barrel of crude oil.
The results
Commodity wise analysis is presented below:
Fuel Oil
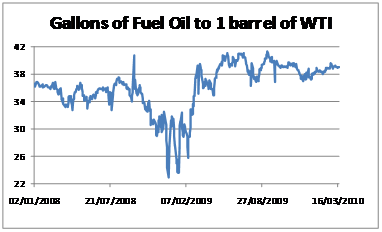
Prior to the last quarter of 2008, the average amount of Fuel Oil equivalent to owning one barrel of WTI was around 36 gallons. The quantity declined sharply in the last quarter of calendar 2008 reaching a low of 23 gallons on 23 December 2008. This trend showed signs of recovery at the end of February 2009, and since April 2009 this has stabilized to between 36 and 41 gallons since April 2009. As of19th March 2010 it stood at 38.99 gallons.
[ad#Grey back med rectangle]
Diesel Fuel
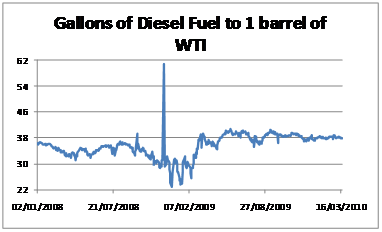
In recent times, since the last half of 2009, the equivalent amount of Diesel Fuel to one barrel of WTI has been around 38 gallons with deviations ranging between 35 and 41 gallons. However, the last quarter of 2008 saw a spike in the ratio at the being on December 2008 (around 60 gallons to one barrel of oil) followed by a steep decline. The ratio reached a minimum of 23 gallons to one barrel of oil on 23rd December 2008. As of the end of the study period, 19th March 2010, the ratio stood at 37.8 gallons per barrel.
Natural Gas
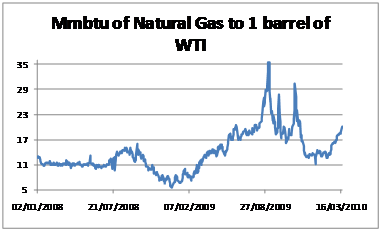
At the start of the analysis period the ratio of Natural Gas to Crude Oil stood at around 11 Mmbtu of Natural Gas to 1 barrel of Crude oil. This increased during the third quarter of 2009 reaching a peak of 16 MMbtu per barrel on 22 September 2009. After that it declined to touch 5.6 Mmbtu at the end of December 2008. Since then it gradually picked up to a high of 35 MMbtu at the beginning of September 2009. For the remaining months in 2009 the trend has been extremely volatile sharply dipping and increasing on a number of occasions during this period primarily due to disproportionately large change in natural gas prices as compared to crude oil prices. It reach the average seen in the early period off 11 Mmbtu in January 2010, but since then it has once again risen and as of mid-March it stood at 20Mmbtu per barrel of crude oil.
Silver
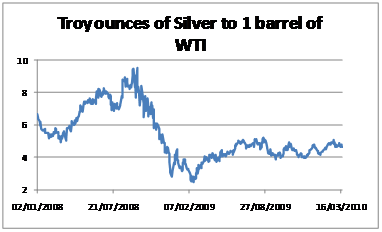
During the period of analysis the quantity of silver that could be exchanged for one barrel of WTI reached at peak of 9.5 troy ounces around the last week of September 2008. After this we see a decline in the ratio indicating that silver was becoming more expensive in relation to crude oil. On 18 February 2009 it was 2.46 troy ounces per barrel. Since then the ration has once again increase though not to the same extent as before. In the first 2.5 months of 2010 it has been around 4.6 troy ounces per barrel of crude oil
Platinum
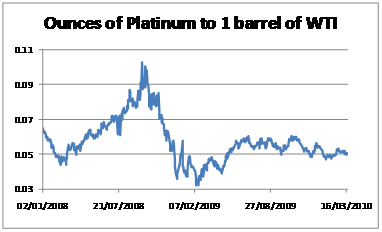
The ratio of Crude oil prices to Platinum prices shows a similar trend to that depicted for silver above. After touching a high of 0.1024 ounces of platinum to 1 barrel of oil on 22nd September 2008 it reached a low of 0.032 ounces in February 2009. After this Platinum has lost some of the value that it had gained against crude oil and as of the end of the study it stood at around 0.05 ounces per barrel of crude oil.
Aluminum
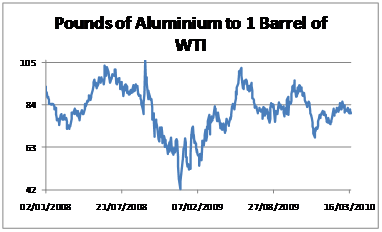
At the start of the period of analysis 92 pounds of aluminum could be exchanged for 1 barrel of WTI. This increased to just under 106 pounds by the end of September 2008. However, after that as the prices of oil declined the Aluminum that could be exchanged went to as low as 42 pounds per barrel at the end of December 2008. Since then as the prices of WTI once again picked up the ratio stood at around 100 pounds at the end of May 2009. By March 2010 the ratio has stabilized to around 80pounds per barrel of WTI.
Steel
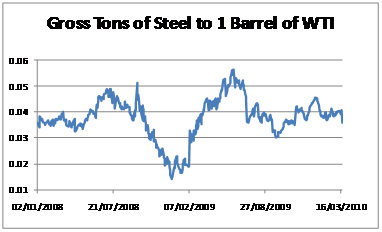
In March 2010 steel stood at 0.035 gross tons to one barrel of WTI the same as the level at the beginning of the study period. During the period significant deviations in this ratio was experience, in particular a low of 0.014 gross tons at the end of December 2008 and a high of 0.056 gross tons in the beginning of June 2009.
Copper
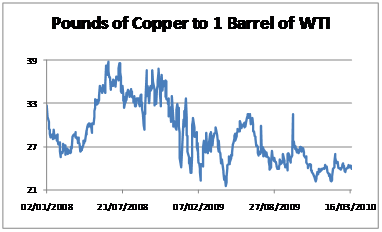
After attaining a peak of 38.76 pounds of copper to 1 barrel of WTI the trend in this ratio has being on a decline in general. There have however been periods of severe volatility faced in this trend during the latter half of 2008. As of March 2010 the ratio stood at around 24 pounds of copper for 1 barrel of crude oil.
Cotton
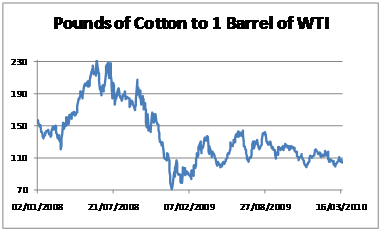
The ratio of WTI prices to cotton prices reached a peak in earlier June 2008 where 231 pounds of cotton could be exchanged for 1 barrel of WTI. During the last quarter of the calendar year 2008 the ratio declined reaching a low of around 70 pounds, around 30% of the June 2008 maximum on 23 December 2008. Since then WTI has regained some of its value against cotton and as of March 2010 it showed at increased of 47% over the end year 2008 figure to stand at 104 pounds per barrel of crude oil.
Corn
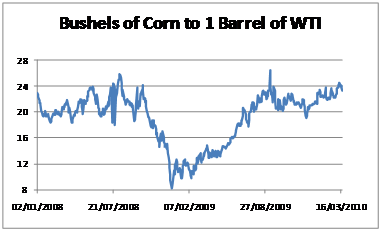
In March 2010 the ratio of corn to crude oil stood at 23.28 bushels of corn per barrel of WTI. This is a return to what was generally the level prior to the last quarter of 2008. In this period the ratio fell drastically to touching levels as low as 8 bushels per barrel as at end 2008. Since then the ratio has increased gradually as oil prices recovered.
Wheat
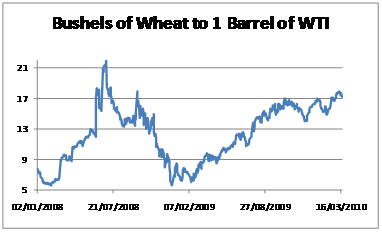
In January 2008 wheat to oil stood at around 6 bushels to 1 barrel. This increased to almost four times this figure in June 2008. After this the ratio fell back to around 5.5 bushels per barrel in December 2008. Since then there has been a steady increase in this exchange factor and as of March 2010 1 barrel of WTI was equivalent in price to just over 17 bushels of wheat.
Coffee
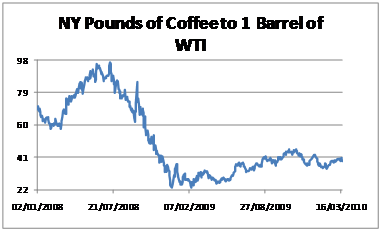
Coffee depicts as similar trend to that seen for the oil to wheat price ratio above. The ratio reached a maximum of 96.75 Ny pounds of coffee per barrel of crude oil in early July 2007 after which it declined over the next half year to reach a low of 23 NY pounds in December 2008. It has risen once again and as of March 2010 it was around 39 NY pounds per barrel of WTI.
Sugar
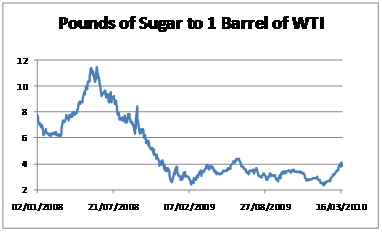
At the start of the study period around 7.75 barrels of sugar could be exchanged for a barrel of crude oil. In June 2008 this increased to a maximum of around 11.5 pounds, followed by a decrease of over 75% to 2.5 pounds per barrel of crude in December 2009. Since then the price has lain within the 2.3 and 4.4 pounds of sugar. As of 19 March 2010 it stood at 3.85 pounds of sugar per barrel of crude oil.
Corn Oil
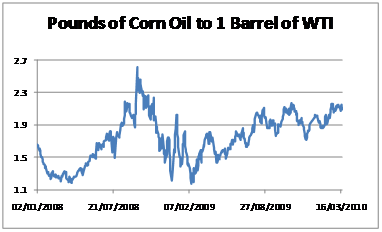
1 barrel of WTI could purchase around 1.7 pounds of corn oil in early January 2008. This declined to around 1.18 pounds per barrel in early April 2008 before reaching a maximum of 2.6 pounds per barrel at the end of September 2008. The ratio declined to a low of 1.17 pounds per barrel in February 2009 before once again picking up. Since then it has generally been on an increase reaching a level of 2.09 pounds per barrel at the end of the period of analysis.
Soybean Oil
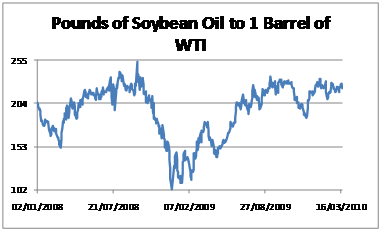
At the beginning of January 2008 205 pounds of Soybean Oil could be exchanged for 1 Barrel of WTI. This declined to a level of 151 pounds per barrel in March 2008. After that the ratio increased to a reach a maximum of over 253 pounds per barrel at the end of September 2008. As oil prices dove in the last quarter of 2008 the ratio declined as well reaching a low of 102 pounds at the end of 2008. Since then the ratio has increased once again reaching a level of 222 pounds per barrel of crude oil in March 2010.
Crude Palm Oil
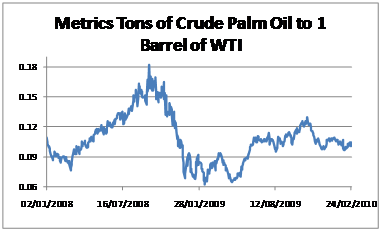
The ratio of Crude Oil prices to Crude Palm Oil futures prices reached a peak of over .18 metric tons of palm oil to 1 barrel of crude oil at the end of September 2008. It declined during the last quarter of 2008, reaching a low of 0.062 metric tons in mid February 2009. For mid 2009 it has stabilized at an average ratio of 0.108 metric tons of crude palm oil to 1 barrel of WTI.