Energy Insights
(Analyst note: Written in May 2009, while this article is dated with respect to pricing and inventory levels it is still a great primer on the structure of the underlying market)
The primary objective of Global Energy Insights is to provide an overview of the history and current landscape of key energy commodities. The need for the section came about when the global growth story hit a major roadblock primarily on account of energy and commodity price supply shocks.
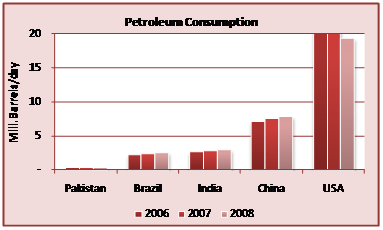
The right way to predict future supply shocks and understand their impact is to understand energy consumption in US, China, India and Brazil and then translate the impact to a local setting. That is the goal we have set out to achieve with Energy Insights over the next six articles.
The first insight issue focuses on products, contracts and consumption patterns in the US market. Future issues will focus on the energy markets in emerging countries such as China, India and Brazil.
1.1 Energy Overview – US
The energy industry as we know of it today is fast evolving due to advances in Renewable Energy sources such as solar, wind, hydro and geothermal heat — all of which can be naturally replenished and are considered eco-friendly. As the global debate on reducing the dependence on oil and migrating to these renewable sources heats up, however, the world continues to remain (and will do so for the foreseeable future) heavily dependent on fossil fuels such as crude oil and natural gas.
Following is an overview of each of the major fuel types and the respective price and inventory levels as of May 1st 2009.
1.1.1 Natural Gas
Natural gas is a non-renewable source of energy used primarily for heating and generating electricity. The main ingredient in natural gas is methane, a gas composed of four hydrogen atoms and one carbon atom. The U.S. procures natural gas from wells within the U.S. and through imports from abroad. The U.S. imports natural gas from Canada and Mexico via pipelines, and in the form of “Liquefied Natural Gas” (or LNG) from countries such as Qatar, Trinidad and Tobago, and Algeria. Natural gas is super cooled and transported as a liquid on tankers before being warmed up and turned into a gas upon arrival in the United States.
The US natural gas industry is dynamic and continuously evolving. Comprised of two primary segments – exploration and production, and distribution and sales – the industry went through a gradual deregulation in the 1980s and early 1990s. This deregulation process was completed with the passage of the FERC order 636 requiring open access to the pipeline system used to transport natural gas.
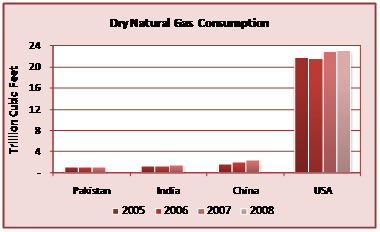
Today, industrial consumers consume approximately 34 % of natural gas, while 20% is consumed by residential customers, 13% is used by commercial customers, and 30% is used for electricity generation. Transactions in the natural gas physical markets are conducted on a daily or monthly basis. Majority of the transactions take place during bid-week, the last week of the month preceding the contract month.
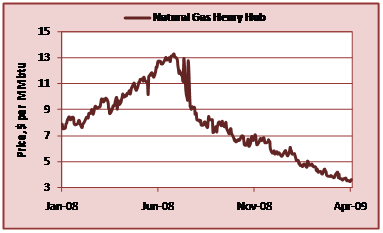
The natural gas market is comprised of a collection of locations with Henry Hub in Louisiana and Waha Hub in Texas serving as major trading hubs. The natural gas futures contract developed by the NYMEX Division is widely used as a national benchmark price. The futures contract trades in units of 10,000 million British thermal units (MMBtu). The price of the NYMEX futures contract is based on delivery at the Henry Hub in Louisiana, the nexus of 16 intra- and interstate natural gas pipeline systems that draw supplies from the region’s prolific gas deposits. The pipelines serve markets throughout the U.S. East Coast, the Gulf Coast, the Midwest, and up to the Canadian border.
As a result of the volatility in natural gas prices, a vigorous basis market has also emerged in the pricing relationships between Henry Hub and other primary natural gas market locations in the United States and Canada. The NYMEX Exchange makes available for trading a series of basis swap futures contracts that are quoted as price differentials between approximately 30 natural gas pricing points and Henry Hub.
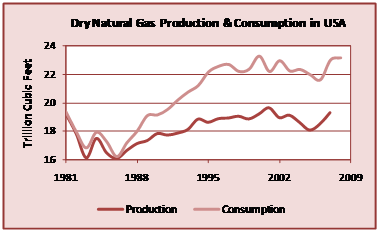
The price of natural gas in the $4.00 – $5.00 / MMBtu range at the time of this publication, significantly lower than the price of natural gas a year ago of $10.66 /MMBtu. Current natural gas inventory levels as recorded by the EIA are also up to 1,918 Billion cubic feet (Bcf) in comparison to 1,427 Bcf from a year ago. The downward correction in the price of natural gas has been caused by low demand due to the global financial crisis and excess supply as illustrated by the inventory levels above. New fields have been discovered in Texas, Arkansas and Pennsylvania.
These discoveries have come as oil has become harder to find and more expensive to produce making natural gas a viable option for achieving long term goals such as easing the impact of energy-price spikes, reducing dependence on crude oil, lowering emissions and speeding the transition to renewable fuels.
1.1.2 Crude Oil
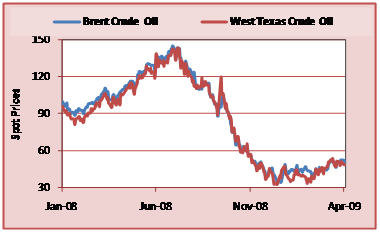
Crude oil is a naturally occurring, flammable liquid found in rock formations. The commodity comes in a wide variety of grades, classified by its gravity and sulphur content. The global benchmark for crude oil is the Brent Crude Oil while the US benchmark is the West Texas Intermediate (WTI) crude oil. New York Mercantile Exchange (NYMEX) and Inter Continental exchange (ICE) are two major exchanges where WTI and Brent crude oil is traded respectively.
Crude oil is regarded as the world’s most actively traded commodity. The NYMEX Exchange light, sweet crude oil futures contract is the world’s most liquid instrument for trading crude oil, and the world’s largest-volume futures contract trading on a physical commodity. Because of its excellent liquidity and price transparency, the contract is used as a principal international pricing benchmark. The contract trades in units of 1,000 barrels and provides for delivery of several grades of domestic and internationally traded foreign crudes, and serves the diverse needs of the physical market.
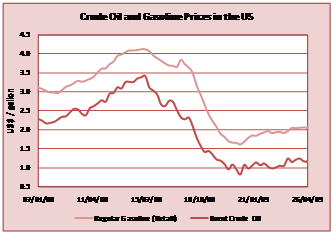
In July 2008, we witnessed the price of crude oil soar to an all time high of $147.27 / barrel and then ubsequently drop to a five year low of $32 / barrel in February 2009. A recent reduction in crude oil production by members of the Organization of the Petroleum Exporting Countries (OPEC) has lowered world petroleum supplies and substantially offset the decline in oil demand caused by the global economic recession.
Since February 2009, the price of crude oil has breached the $60.00 / barrel level. The crude oil market has recently been trading in deep contango – the current month futures contract on NYMEX for WTI are trading at a considerably lower price than the second month contract. In contango market oil companies tend to store more oil to sell it at higher price in the future, which exerts pressure on near month oil contracts.
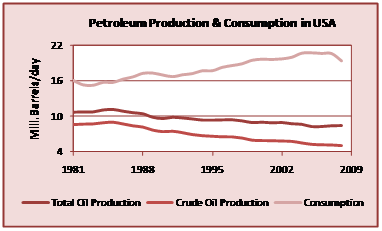
US Crude oil demand and supply drivers
The near term outlook of energy markets is directly connected to the depth of the economic downturn. In 2008, sharp decline in the global economy had a significant impact on demand for crude oil, leading to considerable downward pressure on the price of the commodity.
In addition to the basic demand supply fundamentals, the oil market is influenced by geopolitical tensions, weather patterns, movement in the US Dollar, weekly inventory data and production decisions taken by OPEC. Crude oil prices have a negative correlation with the dollar and therefore a strong dollar can put a downward pressure on oil prices.
US Gasoline prices
The decline in crude oil prices was followed by a considerable drop in the price of gasoline by December of 2008. This rapid decline in retail fuel prices from the all time highs in July 2008 to the lowest point in December 2008 was driven primarily by concerns of a prolonged and deep recession.
Post December 2008, prices of gasoline began to rise even though global supply of crude oil significantly exceeded demand. This occurred largely as the factors attributed to the weakening of crude oil prices began to diminish. OPEC began to actively coordinate actions to cut output and trim global supply and the US Dollar upward rally began to show signs of weakness. At the same time, institutions with available storage capacity began to speculatively purchase crude oil. These speculators began to buy into the markets as the tide began to change on hopes that oil would be more valuable by mid to late 2009.
It was this institutional buying in conjunction with improved fundamental data that resulted in crude oil’s current price level of $56 /barrel and gasoline prices of
approximately $2.2 / gallon nationwide. According to the Energy Information Administration (EIA), average price per gallon of regular gas over the summer is expected to be $2.21 / gallon. EIA also anticipates the price of diesel to remain down from last summer at a cost of $2.26 a gallon. As the summer demand increases and output levels continue to remain stable, we anticipate the price of crude oil to continue to remain above $50 / barrel and rise in the near term. We also expect retail fuel and wholesale oil prices to climb and remain correlated to the broader markets.