The US economy is picking steam, the Chinese economy is heating up enough for the central bank to step in and signal the market that they are still in control, the Eurozone is in trouble, Australia is booming and Oil is hovering around 80 dollars a barrel this weekend. Does this mean that we will see the 100 dollars a barrel price level before summer is here?
Lets investigate this a little deeper. First, the demand front… US crude imports were down 4% as per the EIA numbers released last week. The expected increase in demand in 2010 quoted by EIA as well as a number of OPEC members (including Iran) is in the range of 1 – 1.2 million barrels of oil per day and this is not expected as a spike but as a gradual increase across 2010. In addition to the 4 million barrel plus excess production capacity within OPEC ranks, non-OPEC members are expected to add an additional 1 million barrels of supply in 2010. So while consumption is expected to jump by a single million barrels, there are 4 more million barrels still waiting to be consumed.
[ad#Grey back med rectangle]
So what is driving oil higher? China, no. Coup in Niger, possibly yes. Bearish dollar, not sure. Rosy global growth forecast, certainly not.
Lets take a look at that last one again. Hard Assets Investor has a fairly insightful piece on the Baltic Dry Index (BDI), shipping rates and their comparison to the peak 2008 levels for both BDI as well as shipping rates.
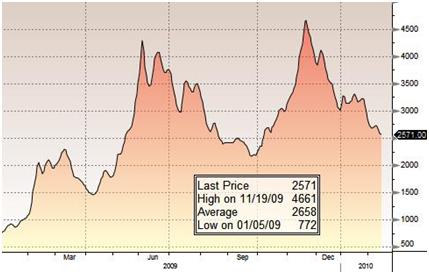
While BDI has certainly recovered from its January 2009 lows, it still headed south end of last year and early 2010. Here are some quick rates comparisons done by Hard Assets Investor
|
Shipping benchmarks |
Feb 2010 |
Peak 2008 levels |
|
Baltic Dry Index |
2,571 |
11,793 |
|
Cape Size 150,000+ton Spot Charter rates |
29,259 US$/day |
230,000 US$/day |
But the really interesting nugget of data in the Hard Assets Investor piece is a snapshot of Forward Freight Agreements (FFA) that clearly show that market expectations do not include a steep rise in freight charges
Apr – Jun 2010 33,750
Jul – Sept 2010 31,500
Oct – Dec 2010 29,500
Jan – Mar 2011 27,500
And the rates dip lower as we head into 2012 and 2013. The shipping industry is certainly not expecting a quick jump in global logistics demand.
Net, net demand and BDI are both bearish on oil. Rather than Peak oil, we are seeing increasing references to Peak Demand in analyst coverage. The supply is just as bad and will possibly get worse as economic pressures in Iran, Venezuela and other Middle Eastern and African players push compliance further below 58%. At the 3% rate it is slipping per month by the time we hit the week for the 17th March 2010 OPEC meeting quota compliance would have slipped by another 6%. That is a lot of oil floating around in a market without active demand.