In the following series of posts, we shall delve deeper into analyzing crude oil in terms of its relative price in different currencies, the correlations between different currencies and oil prices, and the correlation between crude oil and gold.
Crude Oil Analysis: Correlation between WTI and Brent
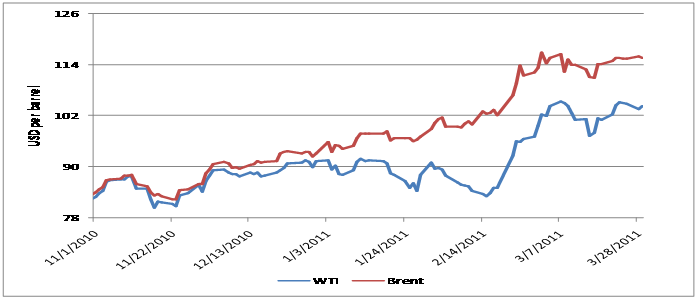
There has been a spread, or a difference, between the WTI and Brent spot rates prevalent at any time in the market. Since January of this year, Brent has increased in price compared to the spot price of WTI, which is in contrast to WTI being historically priced above Brent. There are several possible reasons for this apparent spread, and the major ones are listed below:
- The Midwest region in the US is oversupplied with oil coming in from the north in the form of Canadian imports, and oil coming in from the Gulf of Mexico in the South. This surplus supply of crude oil results in low price at Cushing, Oklahoma, which is a major oil transit town in the US and is the place where the WTI index is set.
- Brent production peaked in 1999, after which it has been constantly declining. Due to a continuous decrease in its supply, Brent has a higher price compared to the WTI.
- Brent crude originates from the North Sea and is mostly exported to Europe, while the WTI crude oil is supplied in the US for domestic usage. Both of these cater to different markets, due to which their prices are bound to vary from each other. Also, Europe is the major market for Libyan oil. With Libya currently under a bloody civil war, Brent has felt the brunt of the reduced supply of oil from Libya, since Brent stocks were required to plug in the supply disruption. Therefore, Brent prices have increased more as compared to WTI on account of the Middle East crisis.
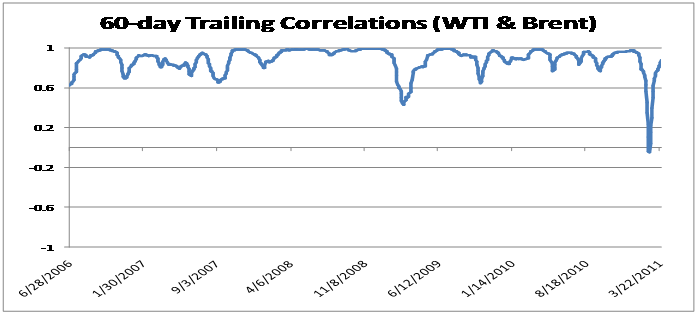
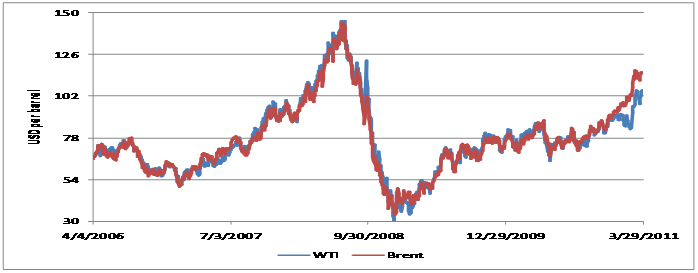
Over the past five years WTI and Brent spot prices have tracked each other closely. However in the last 3 months as noticed below the spread between WTI and Brent spot prices widened considerably (by almost USD 20 in mid-February 2011), primarily due the influence of the recent and on-going Arab revolutions on Brent’s prices, particularly the current fighting in Libya between rebels and Muammar Gadhafi’s forces. This is also illustrated in the trailing correlations graph below where the correlations dipped sharply in mid-February 2011. Since then correlations have returned to pre-political crisis high positive levels, 0.88, though spreads of Brent and WTI have not narrowed by much (they were USD 11.24 on 29th March 2011).
Spot Prices: April 2006 – March 2011
Spot Prices: November 2010-March 2011
Trailing Correlations