Adnan, Agnes and I have been talking about the deviation between oil price and natural gas prices for some time. A few days Agnes pulled together the data to answer two basic questions
a. How correlated are Crude Oil (Brent) and Natural Gas (Henry Hub) prices
b. Is this correlation stable over history or are there periods of deviation
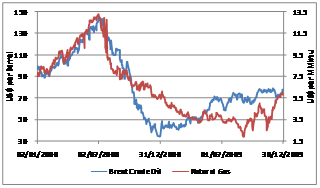
The discussion started when we first looked at the numbers that came out with the December 2009 natural gas volatility update. Then I asked Adnan what his outlook on natural gas was and his take was stable prices, possibly heading south in the short term but expected to pick up by the end of the year. Then Agnes ran the numbers and we ended up with the diagrams you see below.
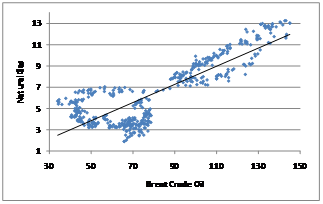
Scatter plot
Form: Linear
Strength: A relatively clear fit of data to a non-horizontal straight line. Concentration of points around the line of best fit indicates a high correlation however there areas in the plot showing that the data points are more widely spread out as compared to the commodities discussed earlier.
Direction: Positive incline from left to right
Outliers: No significant deviations.
Over the entire period of analysis the value of the correlation coefficient suggests a high positive correlation between natural gas and crude oil prices. However we see significant variation over various subsets of the data. In general during 2008 the correlations remained fairly high throughout the year.
However, in the first half of 2009 we see a low level of negative correlation between the two commodities implying that as the prices of crude oil increased there was a 47% likelihood that natural gas prices would decline. The second half of 2009 shows once again a positive correlation to crude oil prices but the magnitude of this correlation remains low. So what is the story behind this sudden de-linkage in price movement and the rise in volatility. Is it all seasonal? But if it is, how do you explain December ’07 and December ’08?
|
Duration |
Correlation coefficient |
|
Jan08-Dec09 |
0.84 |
|
Jan-Jun08 |
0.97 |
|
Jul-Dec08 |
0.87 |
|
Jan-Jun09 |
– 0.47 |
|
Jul-Dec09 |
0.44 |
|
Jan-Dec08 |
0.88 |
|
Jan-Dec09 |
-0.22 |